SESSystemViewer
A Powerful Interactive 3D Graphics Rendition Software Tool
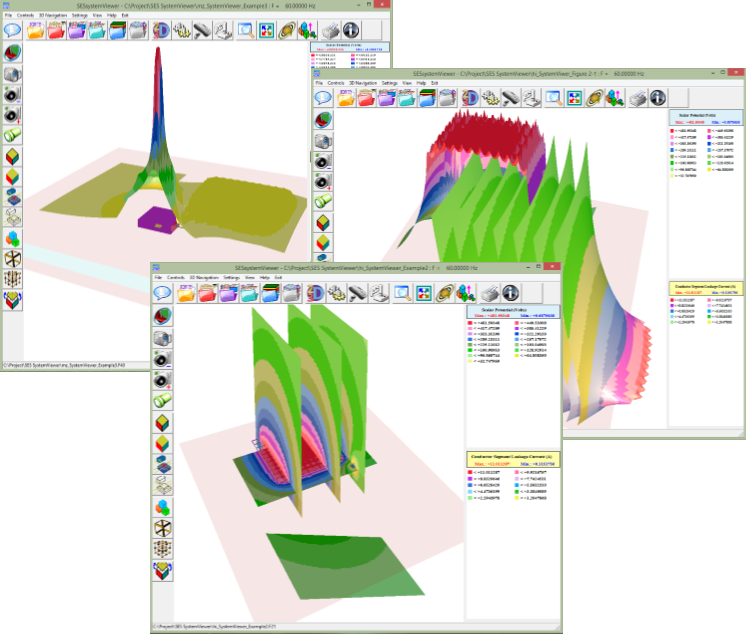
This powerful graphic software tool helps you visualize your entire model, including its surrounding soil structure, as a 3D perspective view. Furthermore, SESSystemViewer displays computation results right on top of the relevant system components in 3D or 2D-spot fashion.
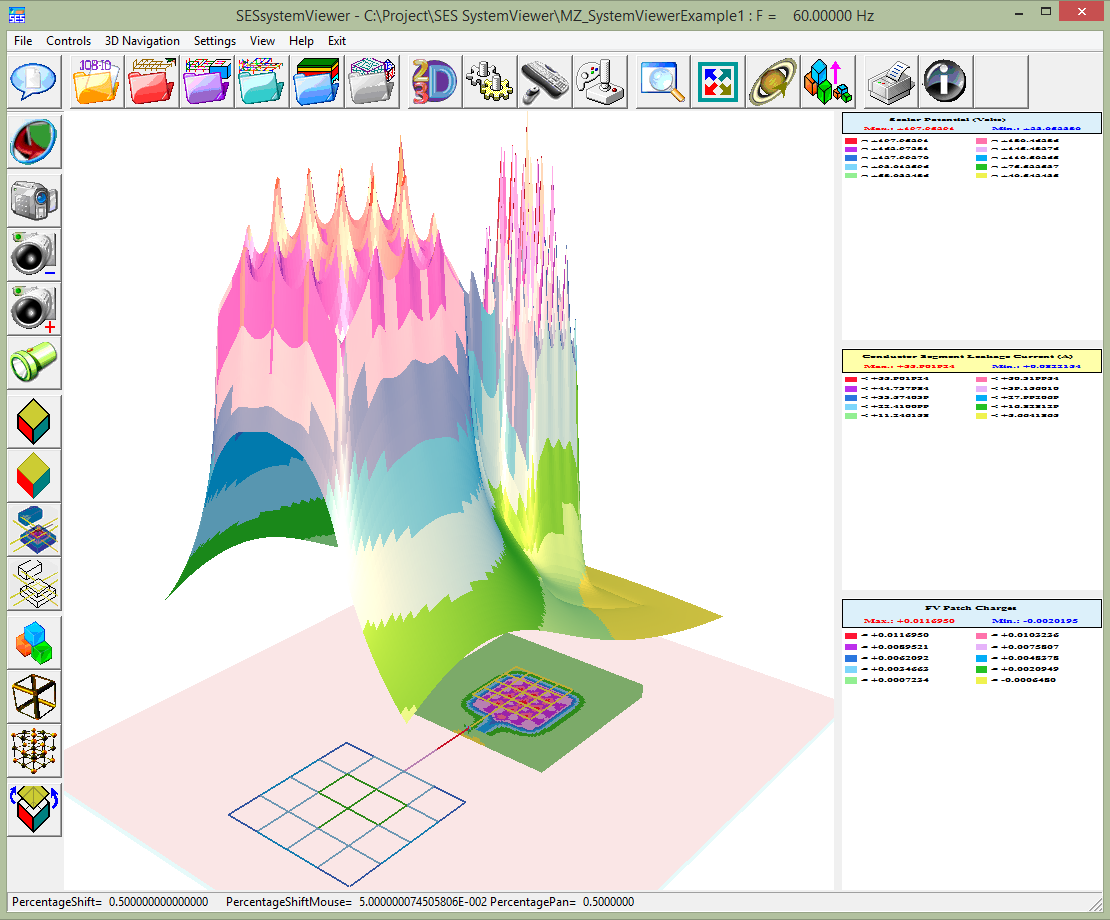
SESSystemViewer displays the system configuration specified by MultiGround, MultiGroundZ and MultiFields software packages. All computation results pertaining to the system configuration can be displayed right on the system component itself in vivid spot colors that reflect the intensity of the displayed quantity such as conductors’ leakage currents, longitudinal currents and ground potential rises (GPR). Computation results are displayed above the specified observation points in 3D or 2D spot plots. Soil layers and finite volumes of soils are displayed with their patch charge densities.
The main graphics computation engine of SESSystemViewer is driven by the OpenGL industry standard protocol. The interface essentially consists of a convenient single window environment that is segmented into seven regions, namely:
SESSystemViewer loads the information contained in the input file or in the computation database and displays it as any combination of the following items:
Users can display conductors as lines of various thicknesses or cylinders with a radius equal to a multiple of the specified one. Conductors are highlighted in various colors representing a range of values associated with input data information (such as radius, material type, coating type or energization type) or with computed data (such as leakage currents, longitudinal currents, conductor GPR and coating GPR).
Computed quantities such as soil potentials, touch voltages, electric and magnetic fields are displayed above specified observation points in 3D or 2D-spot fashion.
Finite volume patches can be displayed as vertices (points), wire frames or solid surfaces.
Linear or logarithmic scale, color levels and shading styles can be specified by the user.
The location of the observer (camera) as well as the increments of the pan and rotation movements can be specified. The X, Y or Z coordinates can be scaled arbitrarily to help better visualize thin objects. Finally, various 3D navigation controls can be reassigned to the mouse left and right buttons and to the cursors.