
GRServer
GRServer is an advanced graphics and report output processor with input processing capabilities. It can display, plot, and print configuration and computation results obtained during previous and current CDEGS sessions. GRServer also has the capability to view the input files, run the computation modules to create the computation database, and view output files. In addition, it may be used to view multiple Windows Metafiles in its convenient multi-window environment.
GRServer generates reports and plots with ease. The plots which are created in each of the plot windows are also created as thumbnails (plot icons) on the sidebar. The thumbnails are used as references to the individual plot windows; clicking on a thumbnail highlights the corresponding plot window. GRServer's multi-window interface allows the creation of as many plots as can be loaded into memory.
The main window allows access to all of the functions which are used for creating reports and plots from the engineering computation database; its multi-document structure makes it an efficient means to compare results and draw conclusions.
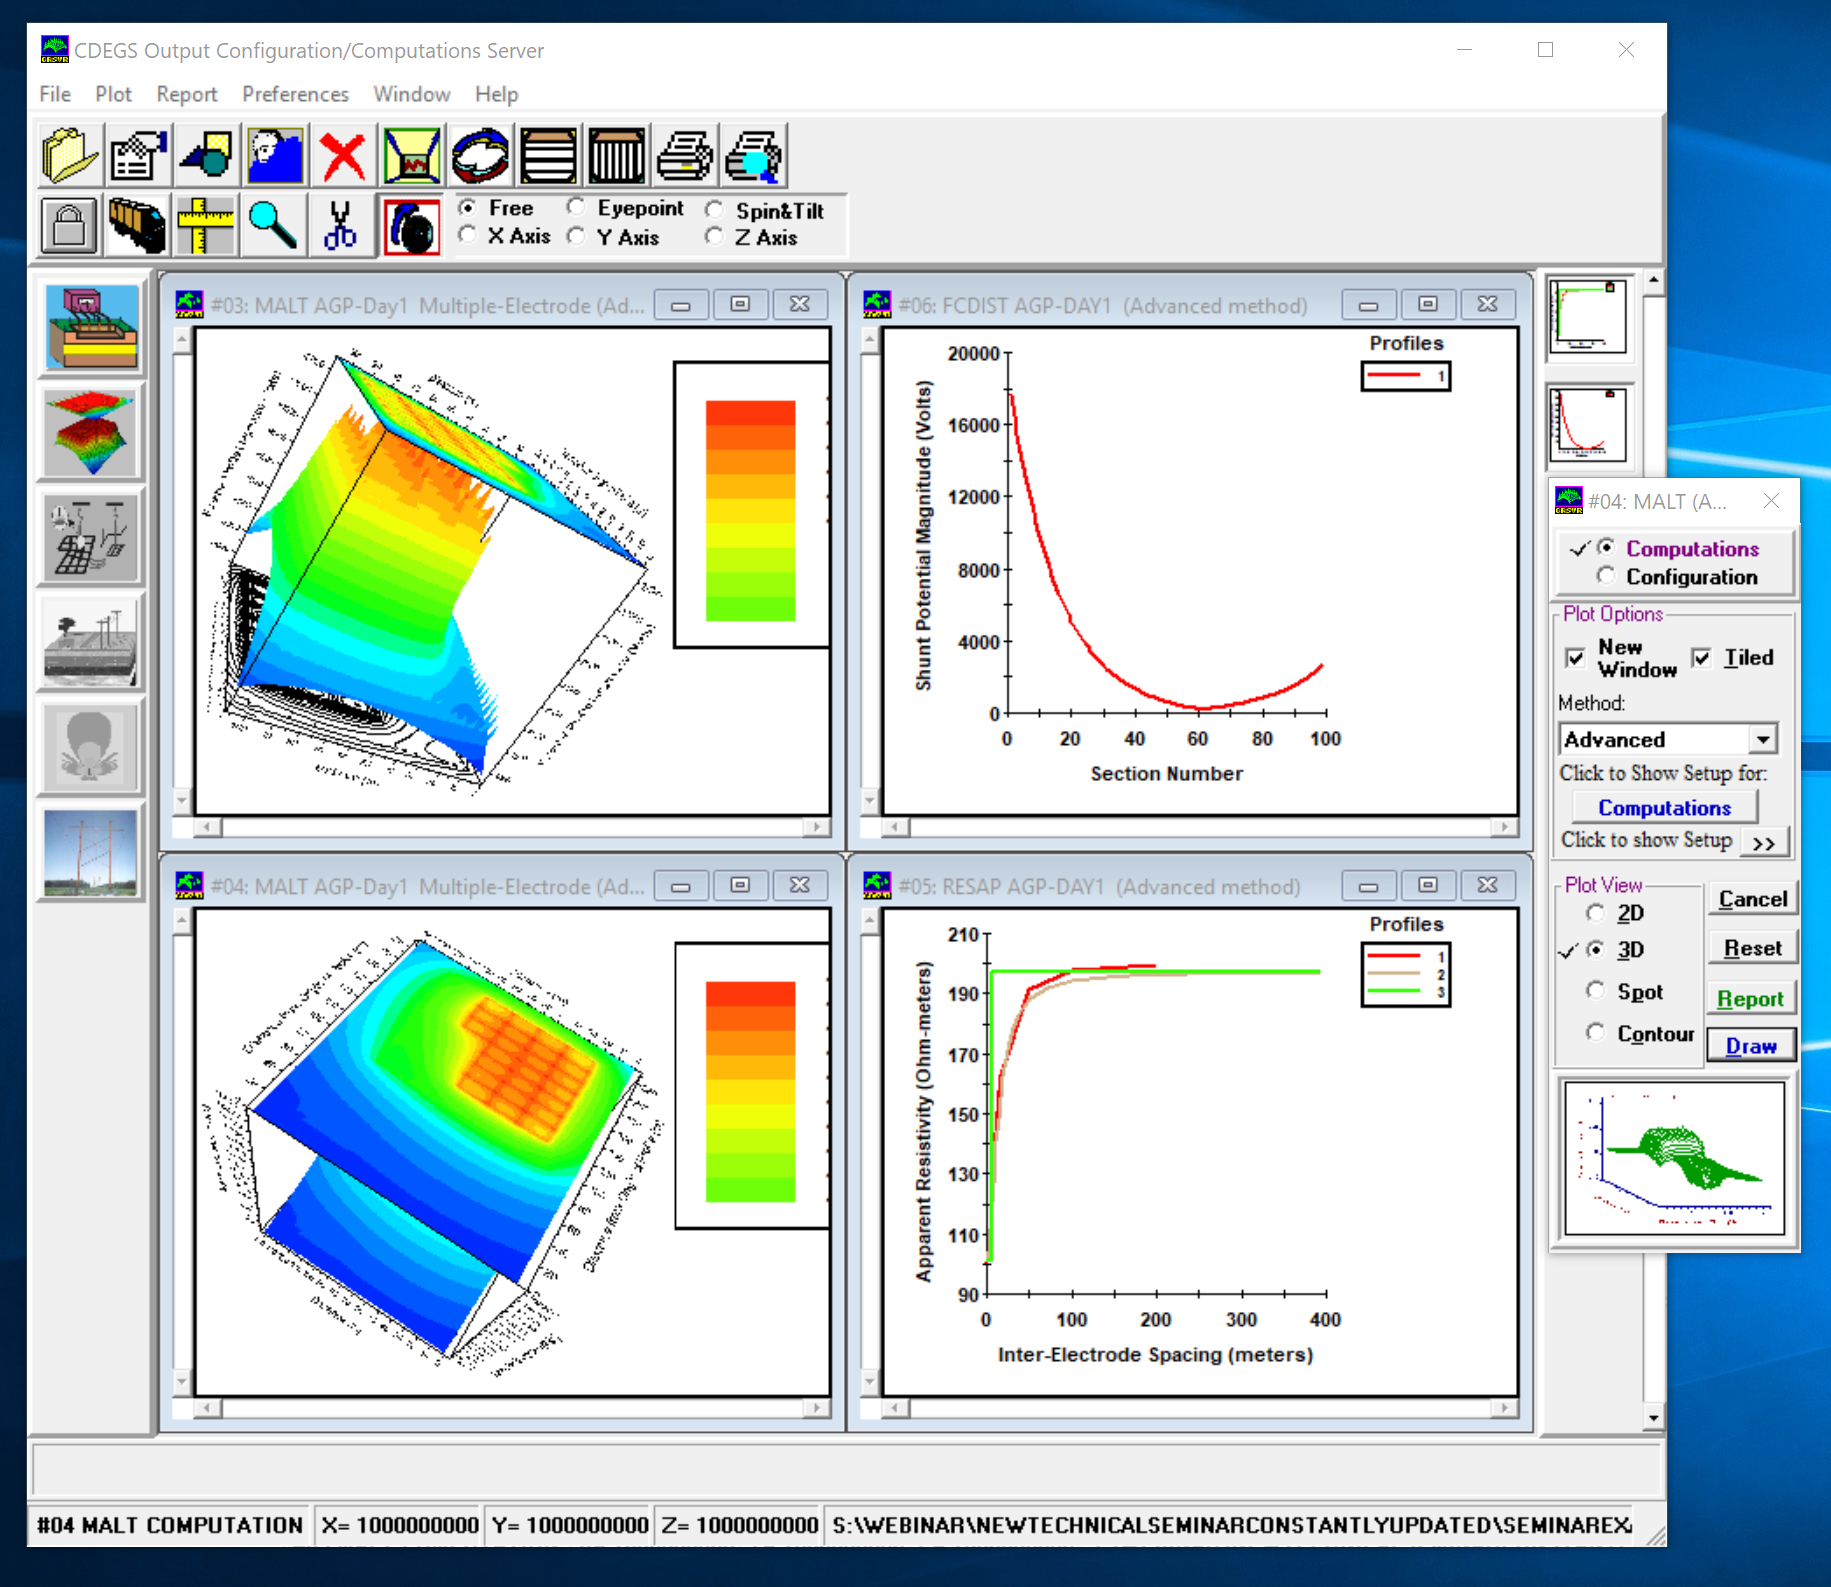
GRServer's Main Screen
The window menu has five distinct components as shown here. The toolbar provides easy access to the most used features that are available in the menu bar. The eight program buttons on the left sidebar are for loading the computation module databases for the programs other than the one that is currently open. Clicking on any of these enabled buttons will automatically load the corresponding database.
The plot icons (in the right sidebar) are the thumbnails of the plots created in the plot window space. There is no limitation on the number of icons the sidebar stores because it is scrollable. The limit is only imposed by the available resources on the system. Clicking on a plot icon activates the plot window associated with the icon. A pop-up menu shows up when right-clicking on a plot icon. It allows for the printing, saving, and deleting of plots.
Features
Options Window
The Options window is the entry point for generating configuration and computation plots.
Advanced Features
The 3D computations setup window offers a number of different 3D plot options in the General, Axes Attributes and 3D Effects panels. They include options such as displaying a floor and/or ceiling projection of the graph surface, displaying contour lines and/or spot zones, spot-fill styles, and 3D effect options.
Zooming In and Out
Zooming to an area is as simple as dragging a mouse over the area boundaries. If necessary, a more accurate boundary window can be edited to insure that the required area is defined with great precision.
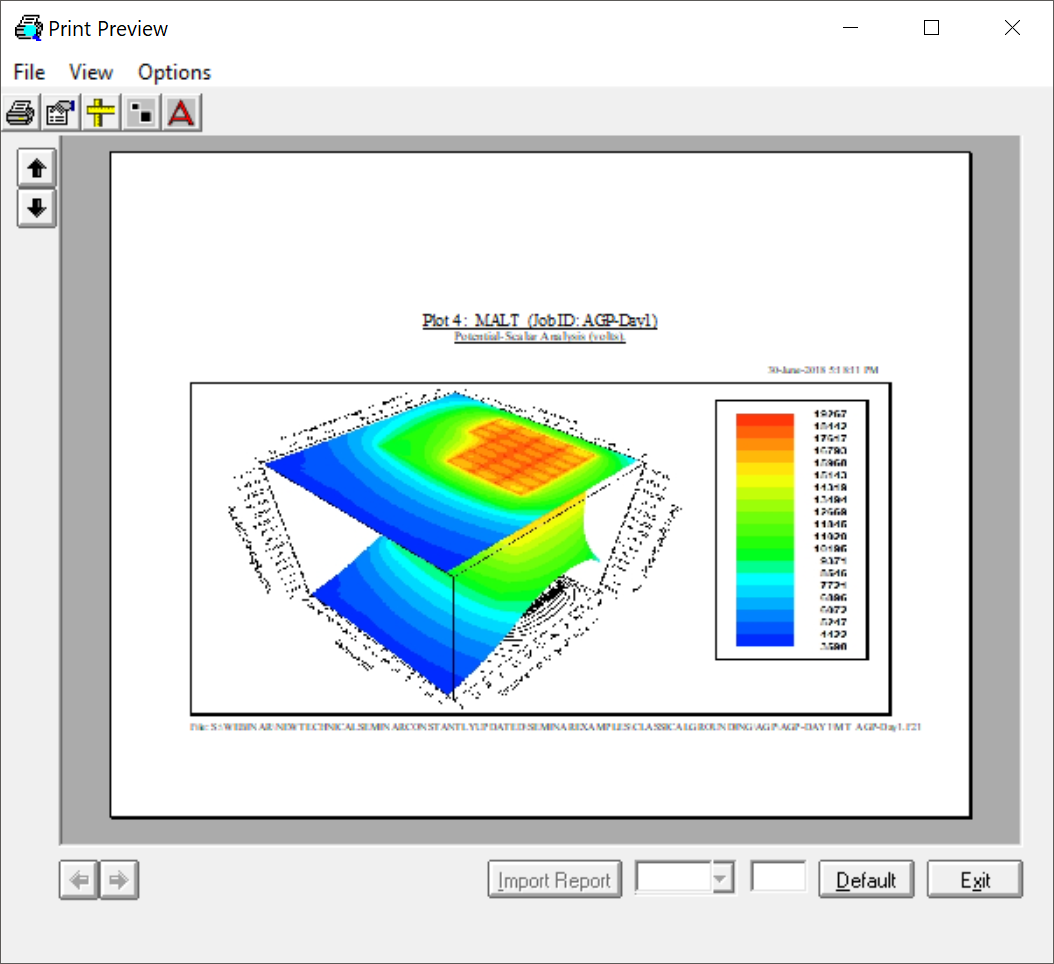
Previewing and Printing
Before sending the plot to a printer, it may be useful to preview it using the Print-Preview feature in GRServer. The preview window allows the user to move and scale the plot to desired specifications. In addition, it allows the user to import reports generated by the report facilities in GRServer.
3D settings: X/Y-mesh, Colored Spot-Fill, Shading Effect, Legend, Spot Zones, Contour Ceiling Projection
Saving to a File or Clipboard
Clicking on either the Save or Save As menu items from the File menu or from the plot icon sidebar pop-up menu saves the current plot to the designated file. A quicker way to acquire the plot image is to copy it to theWindows Clipboard and paste it in any application, which will allow pasting an image from the Clipboard (e.g. Word, WordPad, Corel Draw, etc.).
Updating the Computation Results
The user may rerun the corresponding engineering module to create an updated computation results database. The input file may be modified, printed, and saved from within the editor. The computation modules are run by clicking on the Run CDEGS Program button which is located at the top of the editor window.
Using the Zoom Server to Define Zoom Regions
Zoom regions, for configuration and computation modes, are defined in the Search Zone Vertices grid in the Zoom Options tab (configuration setup screen) or in the Zoom & Report tab (computation setup screen). The zoom coordinates may be entered either manually or by visually selecting a zoom region from the conductor network plot. The visual approach is the most convenient, as this shows all of the conductors and profiles in the engineering database.
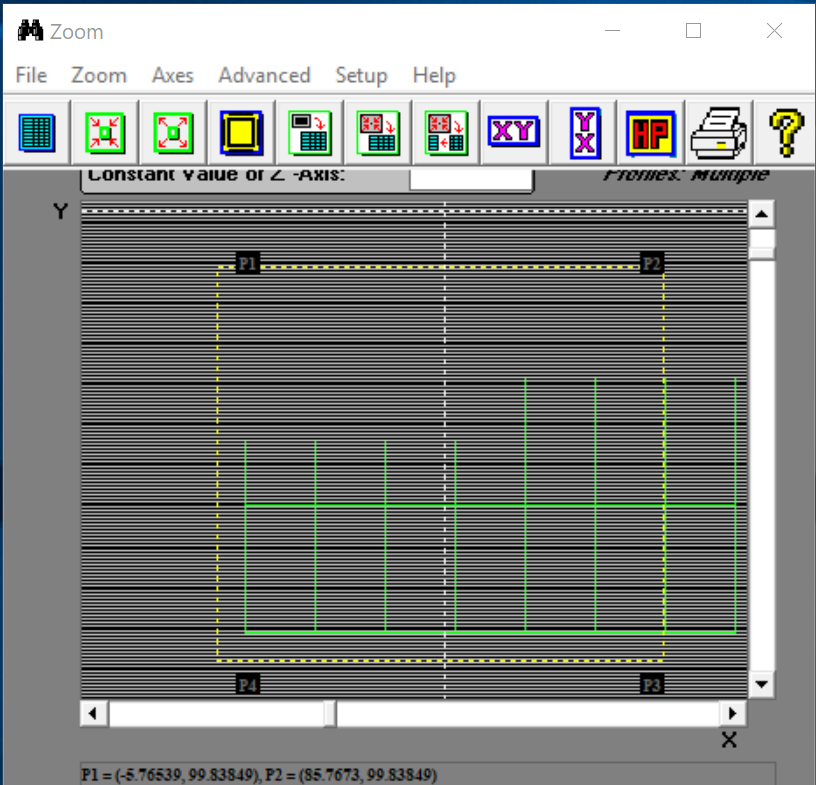
GRServer's Zoom Utility