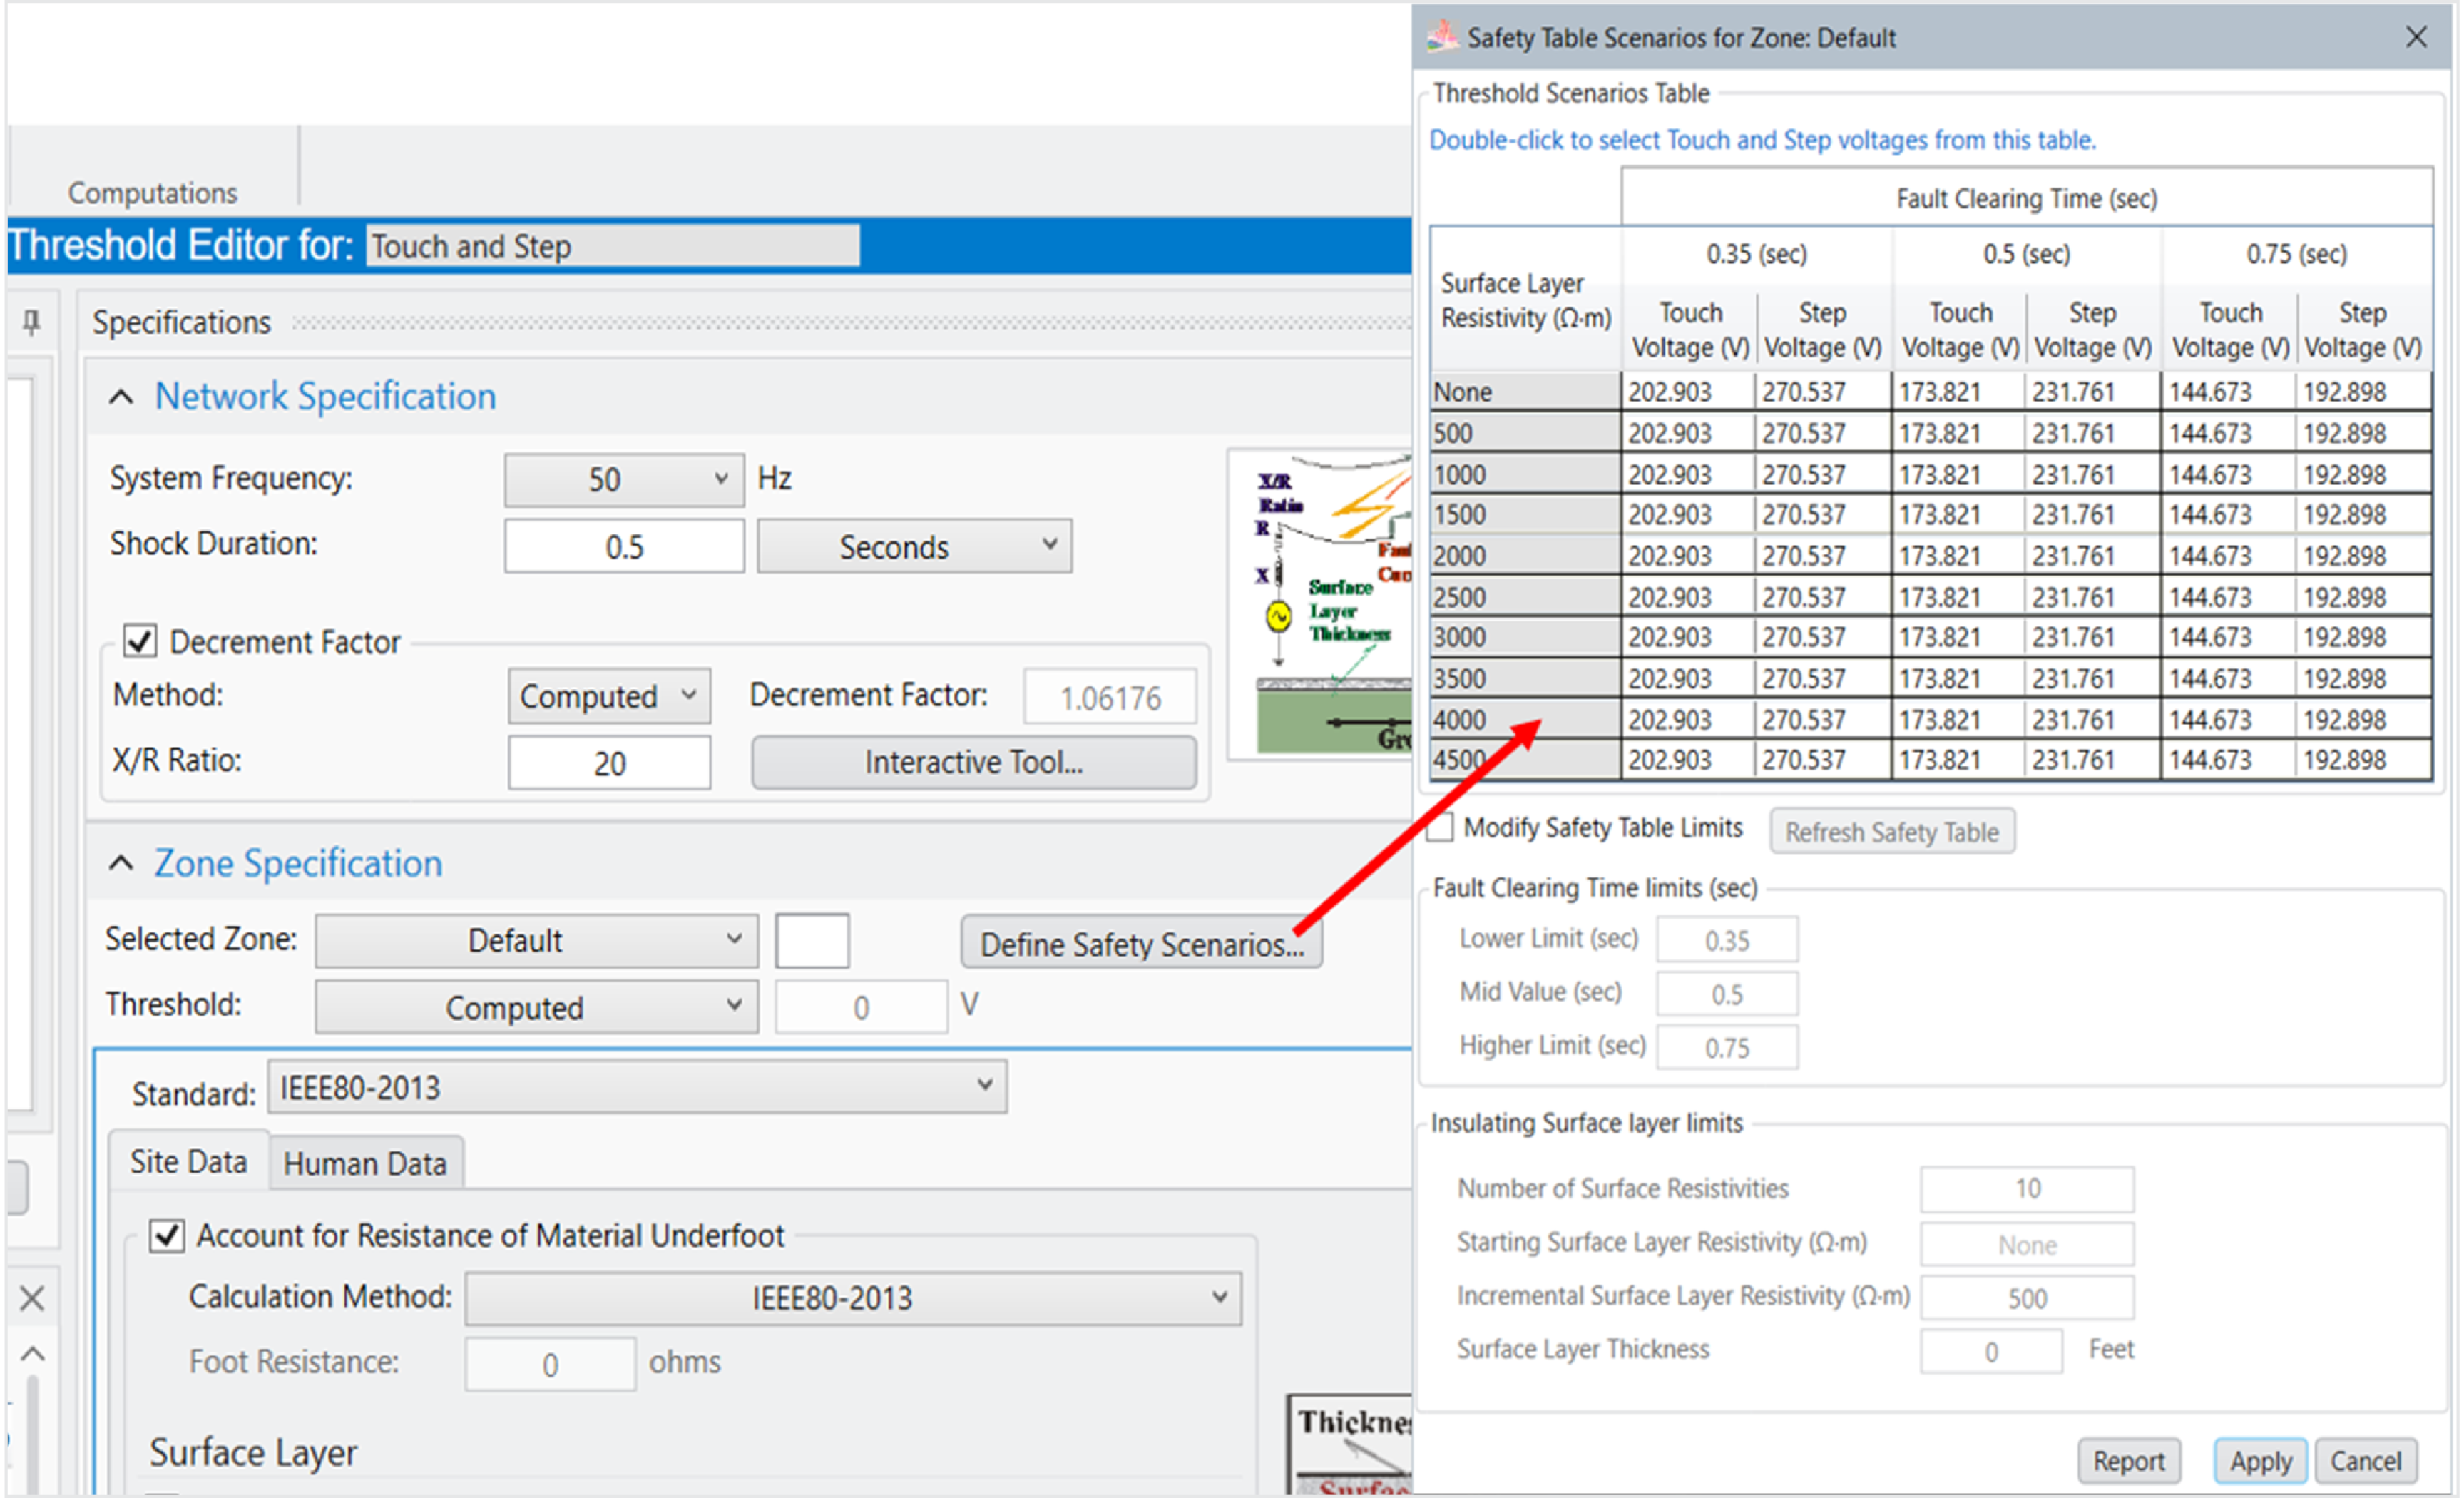
The Safety Table feature, a Safety screen to explore various safety scenarios that had been available in the legacy Output Toolbox, but not in SESResultsViewer, has been recently requested by users. To fulfill this request, this feature has been implemented in Threshold Editor, Figure 7 below, along with the associated Safety Table report. When a safety scenario (based on a desired surface layer resistivity and duration of a fault clearing time) is selected in the Safety Table Scenarios grid, all related parameters are updated in Threshold Editor accordingly.
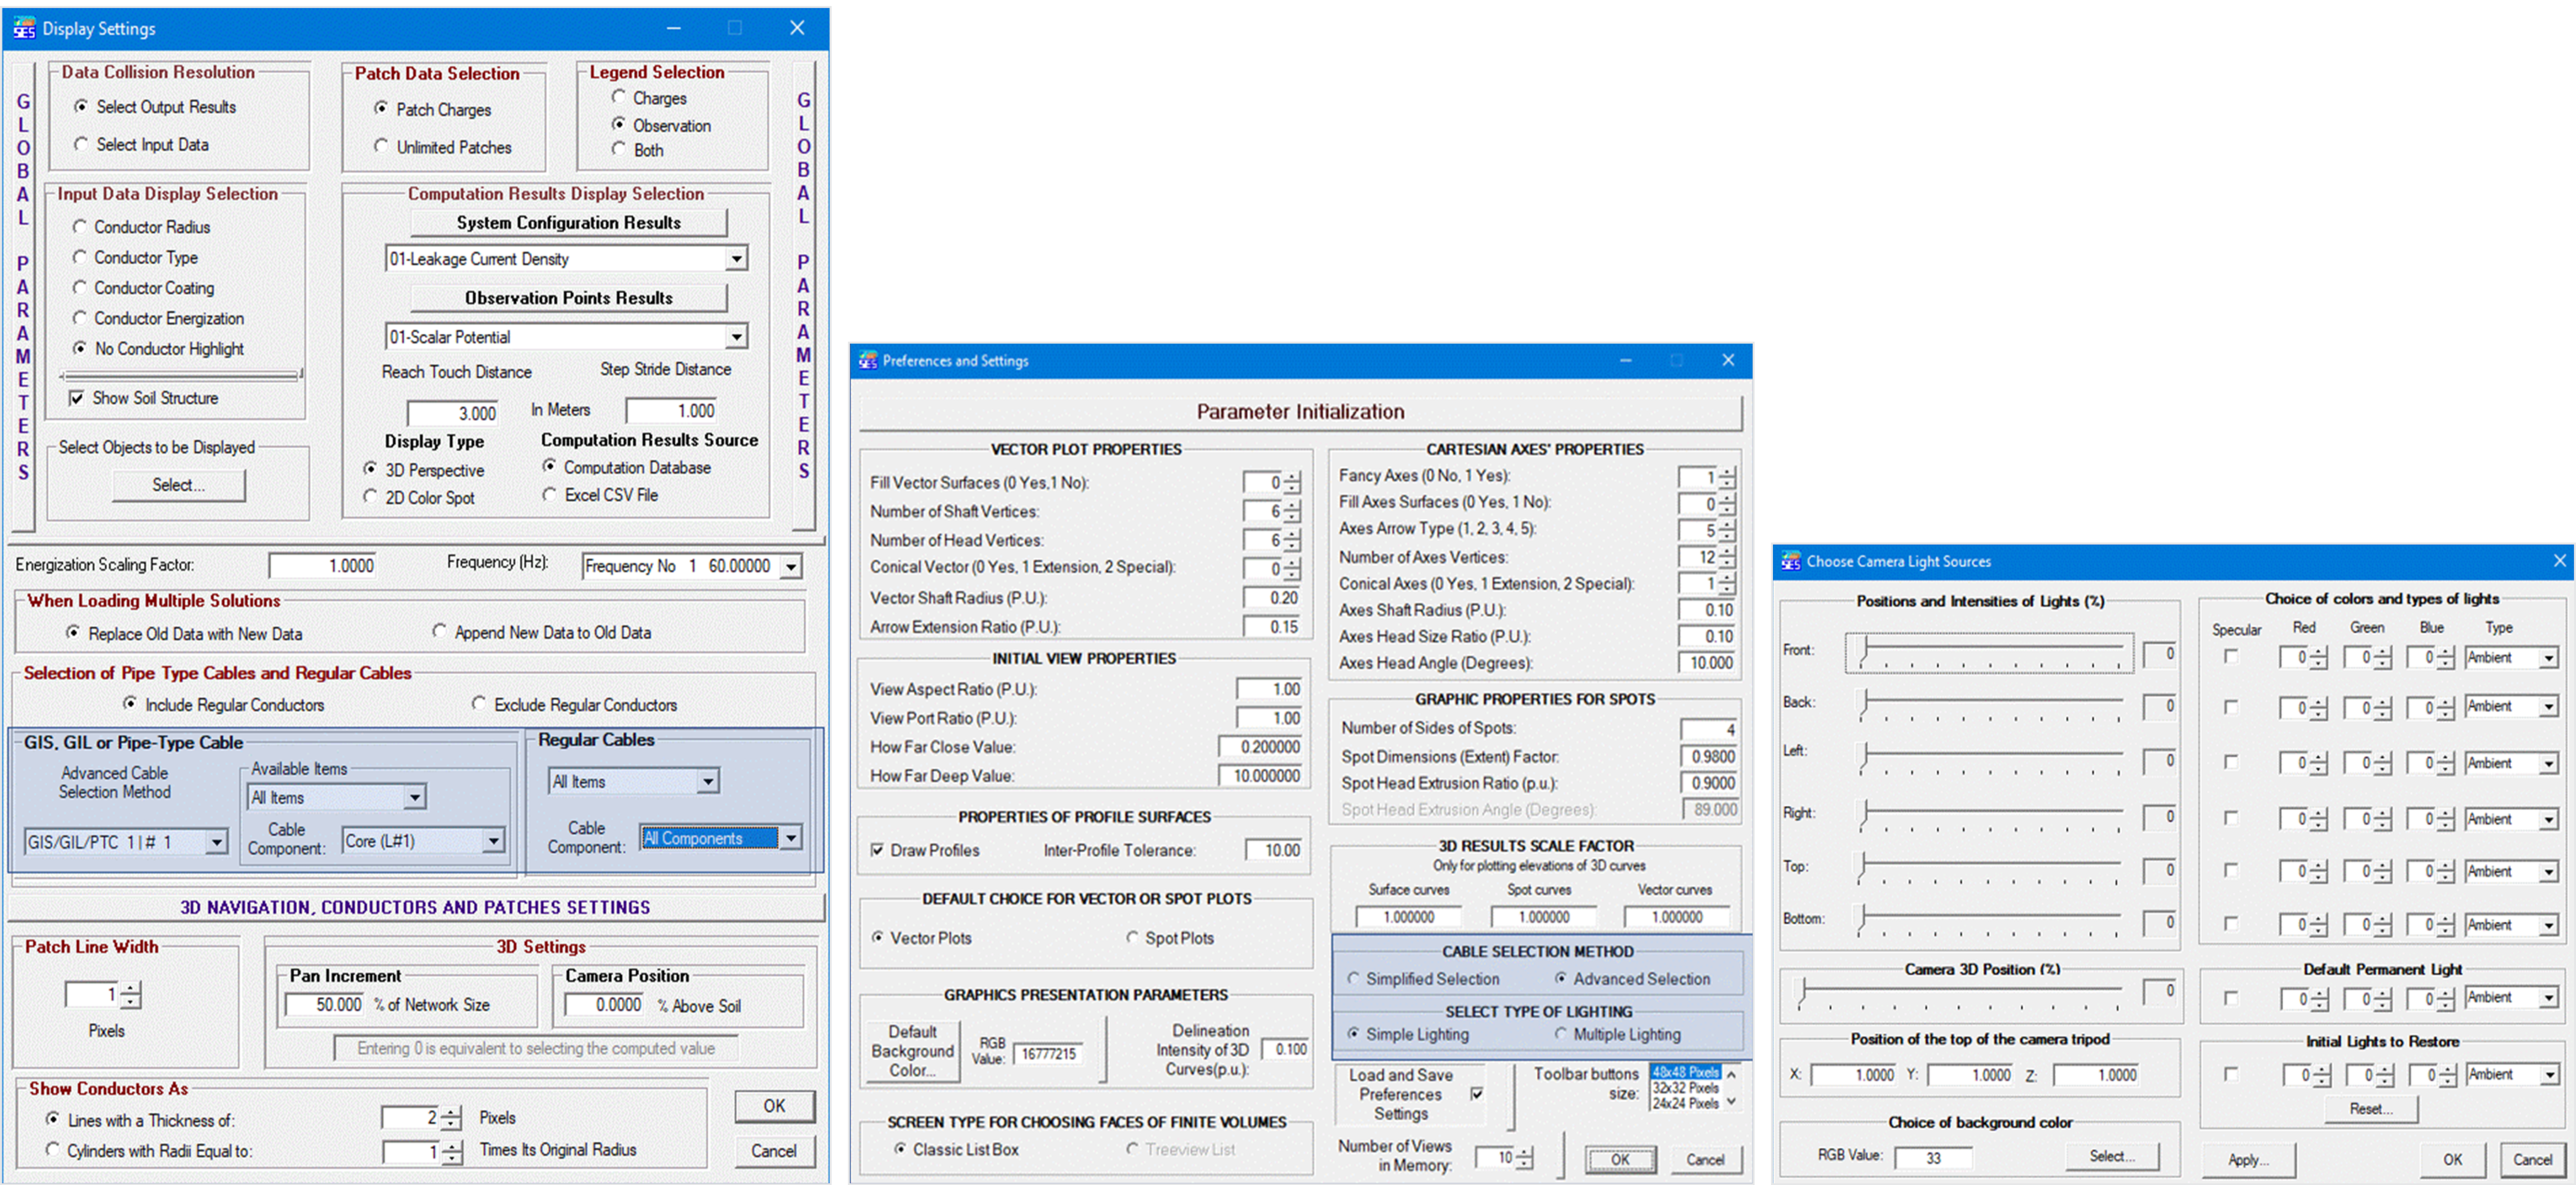
To avoid ambiguities when displaying computation results along cables (for a HIFREQ model) in SESSystemViewer, it is necessary to specify explicitly the component(s) of the cables for which the computation results are desired. This is because the different conductors (core, sheath, armor, enclosure of a pipe-type cable, and so on) that are part of a cable are at essentially the same physical location and can be hard to distinguish.
This version of SESSystemViewer provides greater flexibility with respect to the selection of cable components for which results should be displayed. For GIS, GIL, or Pipe-Type Cables, you can select a specific component of a specific cable, the core of all cables within the enclosure, the enclosure itself, or all cable components. Similar options are available for Regular Cables. The selections can be made independently for GIS, GIL or Pipe-Type Cables and Regular Cables.
Finer control over the lighting used to display the model is also available. You can choose either a Simple Lighting option consisting of two illumination modes, i.e., from one specific direction or from everywhere (no shadows) or a Multiple Lighting option that allows you to select and customize up to six different light sources.
SESPlotViewer
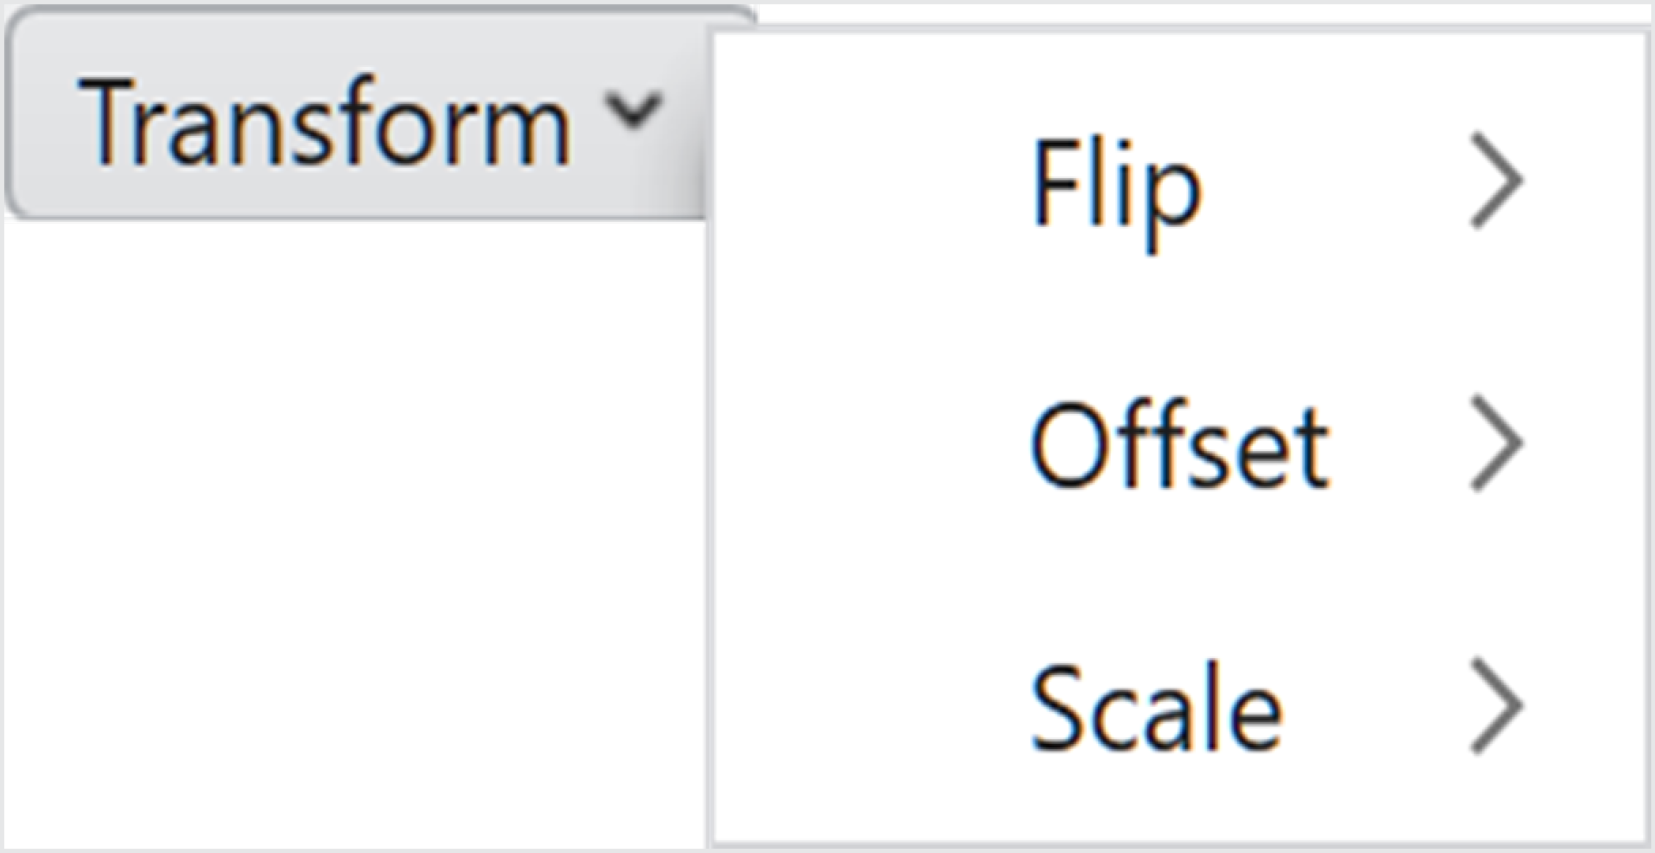
Enhancements have been made in SESPlotViewer to finalize plots without the need to use an external software. In particular, better handling of background images and data series offset, scale and flip transformations are helpful for contextualizing the results presented by the plot. The new 2D-Distance plot also makes it particularly convenient to work with exported data sets from SESResultsViewer, as no calculations are needed to convert a profile’s coordinates to a distance marking. The introduction of inspection and edit modes maintains the convenience of graphical data addition and modification during plot creation, while protecting against accidental changes during results examination. The dynamic data tracker’s behaviour was also enhanced with series locking and color coding to facilitate data inspection. Contextual right-click menus for all objects within the plotting area makes formatting the graph as intuitive as other popular plotting platforms. Finally, data import, export, combining and sorting features have been introduced.
See the article entitled
"Improvements in SESPlotViewer" in the 2023 Users' Group Conference Proceedings for further details.