|
||
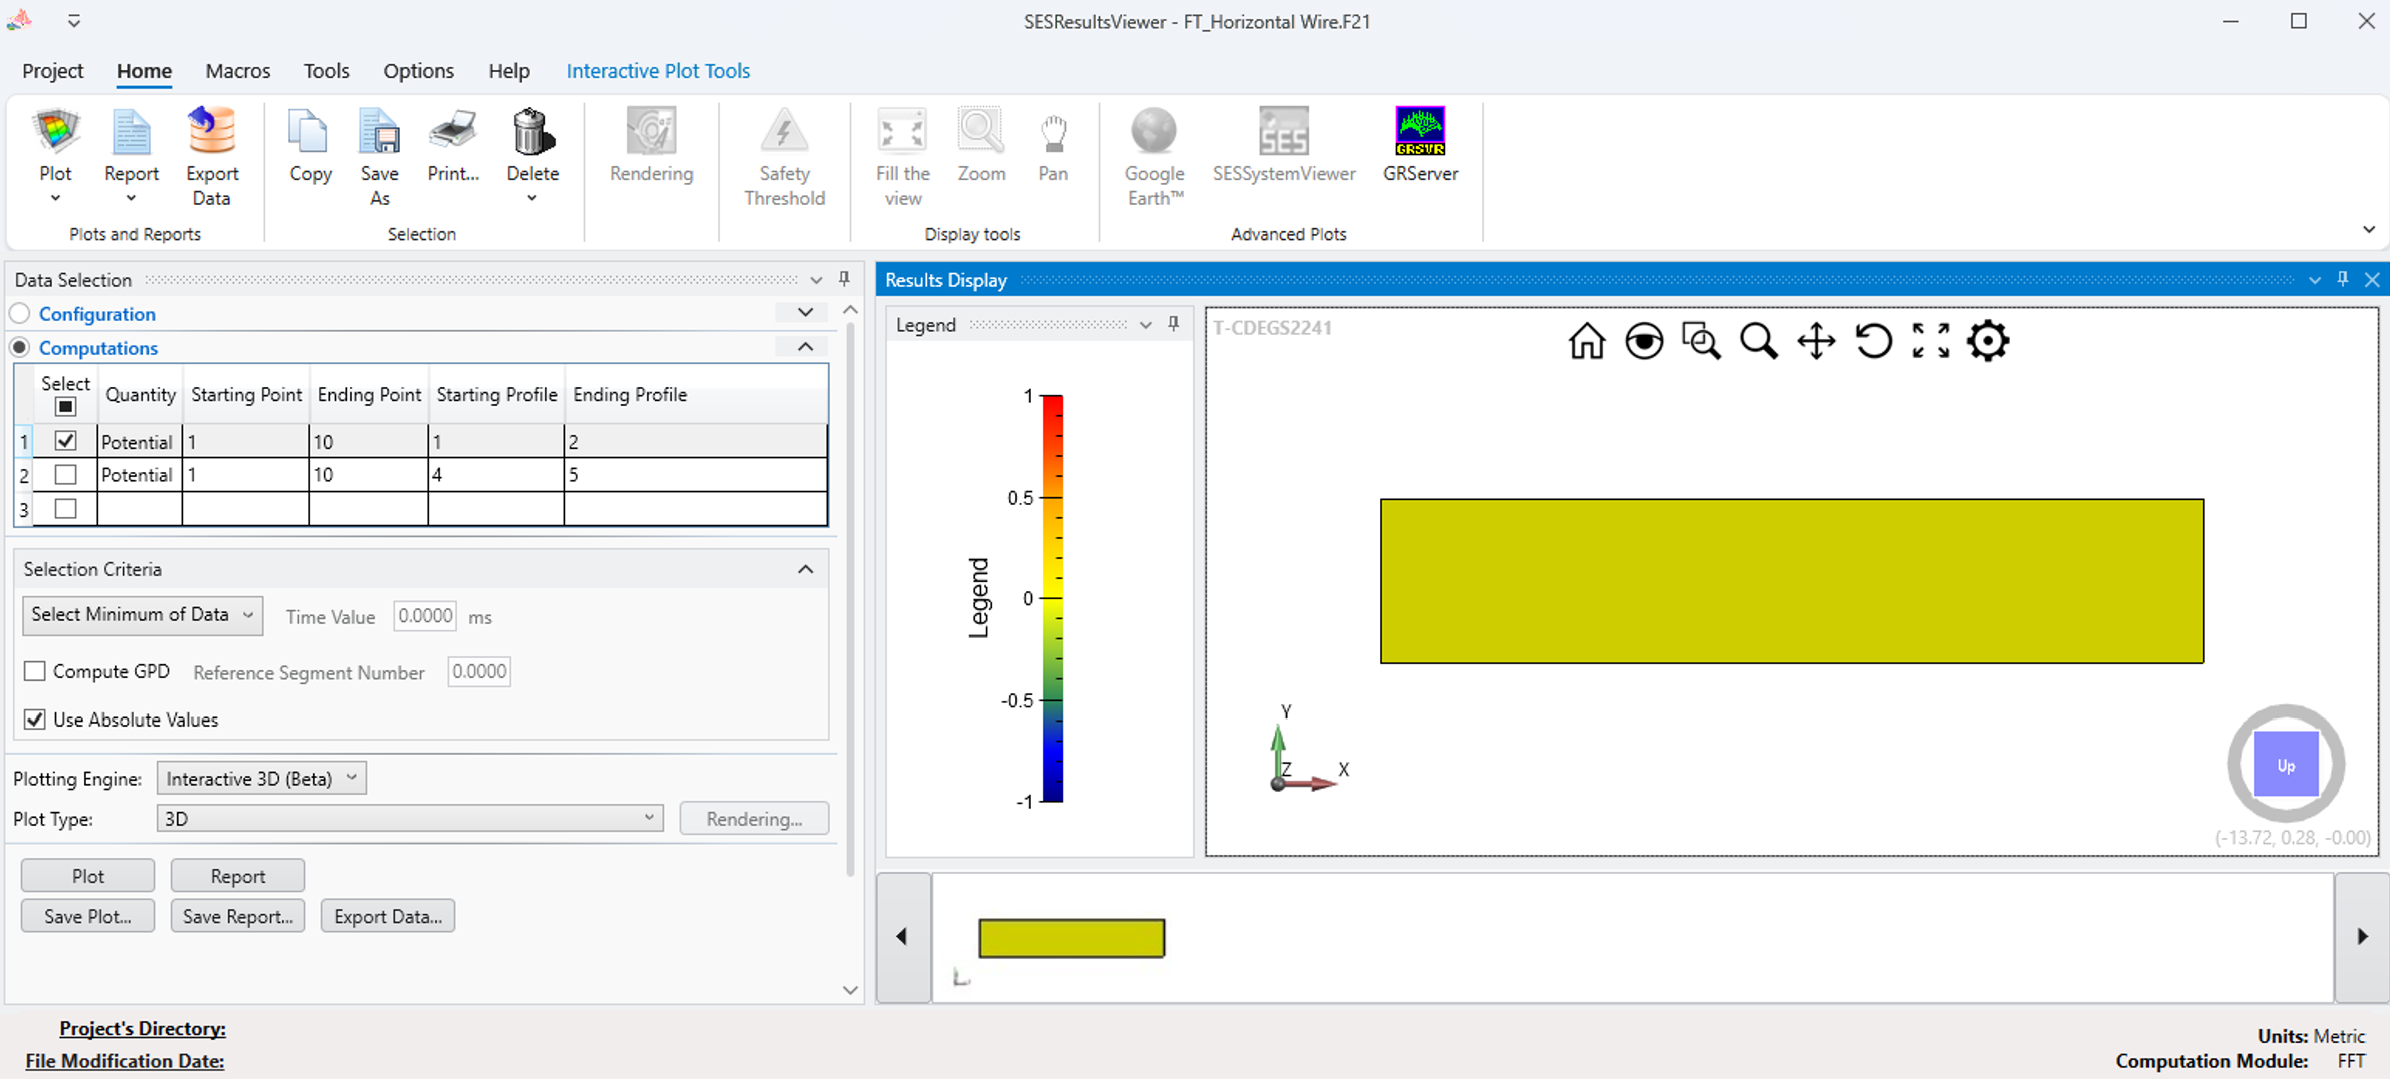
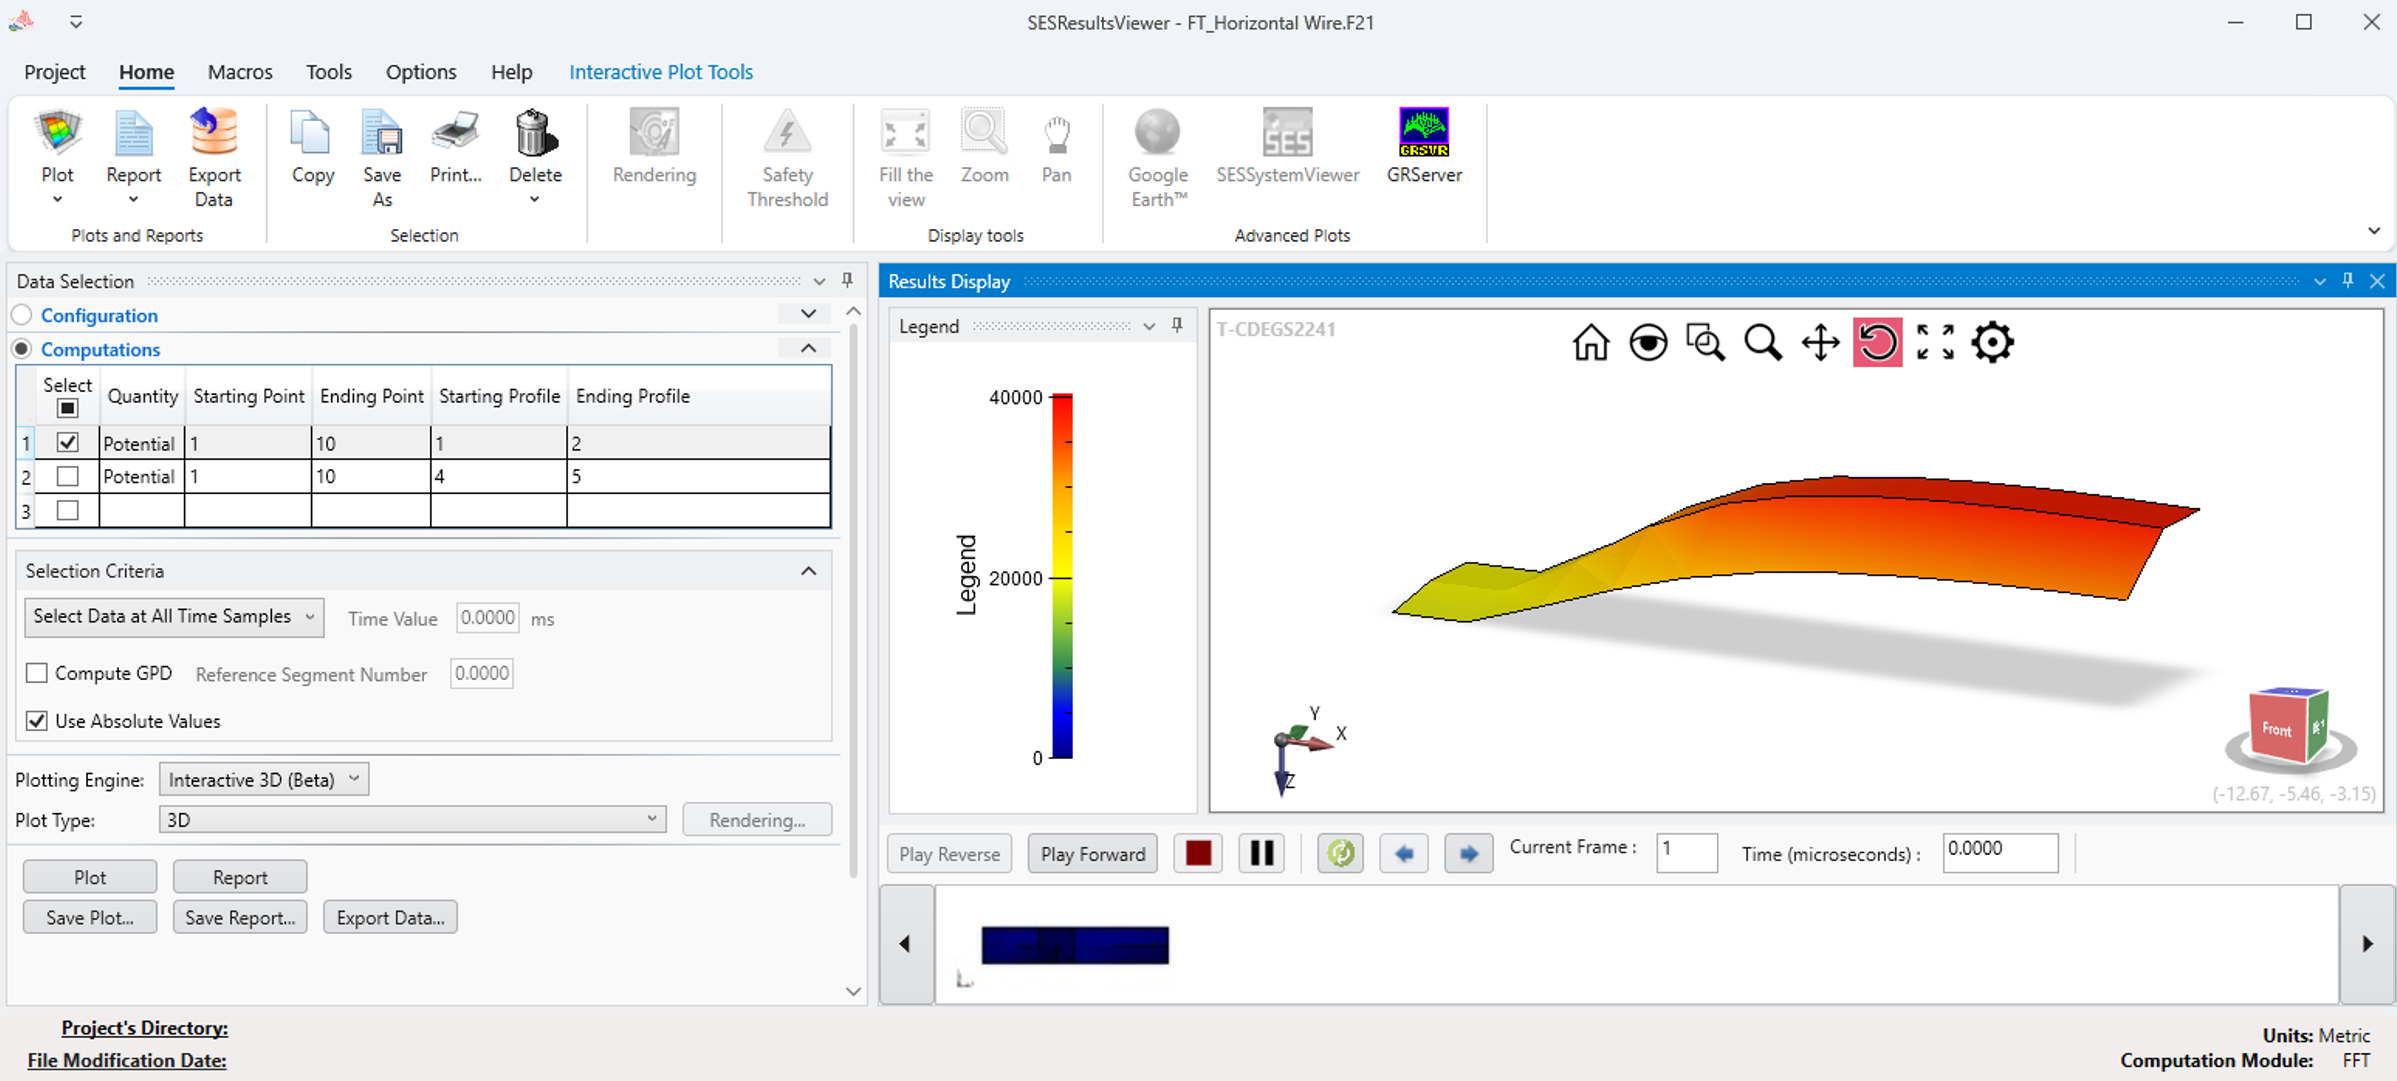
3D Display of FFT Results in SESResultsViewerTo unify the post-processing workflow, the core functionality of the legacy FFT21Data application has now been fully integrated into SESResultsViewer. SESResultsViewer, already widely used for generating reports and plots from .F21 files, now extends its capabilities to support advanced 3D plotting for the FFT module, including time-based animations, previously available only in FFT21Data. 

This integration eliminates the need for multiple tools and will allow 3D results visualization directly in SESFFT and SESTransient. Key improvements introduced with this update include:
With these enhancements, SESResultsViewer becomes a more powerful and central tool in the analysis pipeline, reducing tool-switching friction and providing deeper insight into time-dependent simulation results.
|
||
|